welcome to the astrolomy manual
this document describes astrolomy version 4.1,
released May 31, 2014 under the sign of Gemini
for up to date information visit the astrolomy website
het programma is beschikbaar in het nederlands, maar de handleiding is er helaas alleen in het engels!
astrolomy a été traduit en français mais le manuel est disponible seulement en anglais!
Contents
and have a good time
the beginning
Installation
Drop the Astrolomy application into your Applications folder and you're ready to go!
The first time you run the program you will want to set your local timezone and coordinates in the preferences item on the astrolomy menu. These data are used in some of the calculations and will be remembered the next time you use the program.
Normally you don't need to do anything else, but if things don't look right (no symbols for the planets etc) you may need to install the astrolomy font which you can download from the astrolomy website. to install the font double click on it's symbol and in Fontbook click "Install". Then you need to restart the astrolomy application.
Quick start manual
This is the basic information you need to calculate a birth chart:
- date and time of birth
- geographical coordinates of the place of birth (from an atlas): longitude (East/West) and latitude (North/South)
- timezone
- daylight savings time. if it was in effect at the time of birth, usually you will then set it to +1, in rare cases there will be two hour daylight savings time, so set it to +2
- optionally enter a name and a name for the place (has no effect on the calculation)
- Go to the birth chart item in the charts menu, enter these numbers. If you don't have an atlas use the 'map' button to find the location's coordinates (right click for a contextual menu to change map) and press OK. There it is. Or otherwise you may want to look up the exact coordinates in Google Earth.
-
- Hints:
- Numbers in the chart dialog boxes may be entered directly by typing in, just click on one of the numbers and use TAB to go through all the fields (shift-TAB to go back through the fields, ENTER to calculate, or ESC to cancel).
- if everything seems frozen, maybe you are in an animated routine that is in a paused state, so try pressing the ESC key to cancel that.
In general, nearly all windows (except the main windows!) will be closed when pressing ESC.
Charts
The following charts can be calculated:
single wheel charts (birth & for now charts)
First you may want to change the house system you want to use in the preferences item on the charts menu. Use the keep item to always use this house system, until you change it again. If you want to calculate a 'for now' chart make sure you have made the right settings in the preferences item in the astrolomy menu.
Files may be loaded from disk using open.. on the file menu.
In all cases, except when using 'for now' there will be a dialogue appearing on the screen. In the case of a birth chart it looks like this:
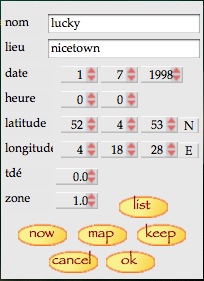 You may change numbers by using the arrow buttons, click on a number to edit it directly, or use TAB and shift-TAB to go through all the numbers and edit them. Use Command-W or ESC to cancel, or the OK button or press ENTER to have the chart calculated.
Enter the date as day-month-year. Possible values for the years range from 1500 to 2100, and leapyears are automatically accounted for.
Time is entered as a 24 hour clock. Latitude and longitude can be found from an atlas and are entered as degrees-minutes-seconds. The last characters, here marked 'N' and 'E' mean northern latitude and eastern longitude. They can be changed to southern/western by clicking on them. Alternatively use the map button, explained below.
dst stands for daylight savings time. Enter the appropriate value at the time of birth. Whether or not daylight savings time is active now is not important. Usually, if active, dst is +1, in rare cases +2.
zone means timezone. Enter the numeric value for the place of birth, usually you can find the value from an atlas use positive numbers for eastern longitudes and negative for western. So Amsterdam is +1.0 and New York is -5.0.
The keep button makes the present setting in the value fields the default set that will always be loaded when the astrolomy program starts up.
map show a map of the Netherlands or other maps. Right click for a contextual menu to change map. Left clicking in the map will enter the longitude and latitude values for the place you clicked on into the appropriate fields.
now will enter the present date and time from the computer's clock into the dialog fields. further information (longitude/latitude, timezone and daylight savings time) is taken from the preferences panel, which is located in the file menu.
list to get the chart information from a chart in the list, if there are any. You can add any birthchart to the list bij pressing command-A.
All charts may be animated.
 The general look of charts may be
changed by settings in the preferences menu, located in the charts menu.
The general look of charts may be
changed by settings in the preferences menu, located in the charts menu.
Animate charts by checking the 'animation' item.
It is also possible to enable/disable houses (if the time of birth is not known, then houses are of little meaning, and an ascendant can not be
calculated, at least only indirectly), aspects (which can sometimes make a chart layout confusing),
30°/150° aspects (semisextile/quincux), that are not very strong aspects and can make the chart more complex. When the aspects item
has been ticked it is possible to make aspects in the drawing 'fade', meaning the intensity of the colour will be a measure of how far off the
aspect is.(note: not implemented in this version)
Set the orbs of the aspects (the range over which they are active) by clicking the 'set orbs' button.
If show latitudes is on in single wheel charts a table of latitudes is shown next to the corresponding longitudes of the planets. If use starmap is on the planets are not shown in a chart but in a starmap. Which starmap is chosen depends on settings made in the preferences item in the stars menu.
Then the chart drawing can be changed to a style more common in the US and in England. The default is 'European style' turned on. Only in this case the 'horizontal ascendant' item is meaningful, and so the check box is dimmed otherwise. Check the horizontal ascendant-item to keep the horizon as a horizontal line. This looks more neat, esp. when doing animations.
The house system can be set from the pull-down menu next to the 'houses' checkbox.
Press the keep button, so that these settings will be used every time you start the program.
When there is a chart drawing on the screen (single or double wheel), click in a house or on a planet, sign or aspect (both in the drawing and in the table in the left bottom corner) to find useful information about these items. The icon of the moon shows its phase. If the right hand side of the moon is lit (visible) than the moon is waxing, otherwise it is waning.
Once a chart has been calculated more items become available in the charts menu. The first item is called add to list. A chart list is a quick way of comparing charts (the list is restricted to 12 charts), and keeping a small database of charts for easy retrieval. The list is not remembered when you quit the program. The chart list can be viewed with the next item, show list. This type of list is maintained in other parts of the program as well. Click in a line and the line will be highlighted. Releasing the mouse then will recalculate the chart. right-click in the table or hold down the control-key while clicking will open a menu to edit entries in the list. Use the buttons on the left to toggle the view between viewing by sign or by element.
The item explanation shows a short explanation for a chart. It is clear that a real explanation of the chart cannot be given unless there is a form of direct contact between explainer and inquirer. calculation of charts is a tedious but mathematical task, astrology just isn't. It really is a pity that people measure the meaning of astrology by statistics. It is much rather a meditation on yourself and things around you of which the outcome is really unmeasurable. So with explanations, it is a subtle task relying on a flow of nonphysical personal energy.
The item mirror mirrors the visible chart in the line from 0° Leo to 0° Aquarius to find more sensitive points in the chart.
The item mandala shows a colorful picture derived from the chart.
The item correction is explained elsewhere.
In the info menu 6 items become available (there are slight differences in the case of double wheel charts):
- show info - general information about the chart, overview of the planets in the signs and elements, superior elements, tarot card by birth date.
- these aspects - a list of aspects in the chart. It lists the aspect, the planets involved, the date and time when the aspect is full, the positions of the planets, and their distance in declination. Like in the chart list, clicking in a line will calculate that particular chart for the moment when an aspect is full, thus allowing a full inspection of the chart.
- coming aspects - a list of aspects coming up in a period of about two weeks after the date the chart was calculated for. It lists the aspect, the planets involved, the date and time when the aspect is full, the positions of the planets, and their distance in declination. Like in the chart list, clicking in a line will calculate that particular chart for the moment when an aspect is full. Click on an entry that contains a date and time to calculate the chart for that moment, thus allowing a full inspection of the chart.
- next full moons - a list of the next 24 full moons.
- next ingress - shows when planets will move into the next signs. By using the buttons on the right one can filter only the transitions for one planet, or for all.
- next returns - for each of the planets a list of the next 'returns', moments when the planet is in exactly the same position as it was in the original chart. This may cause a resonating effect, intensifying the planet.
In all these lists after you calculated a chart from one of the entries by clicking on it, the button 'redo' will become available, which, when clicked, will simply revert back to the original chart. If indeed you calculated a chart and you close the window a dialog appears giving you the choice to revert back to the original chart or to continue working from the presently shown chart.
-
double wheel charts (progressions and synastry)
A slightly more complex dialog shows up. In the case of a progression it looks like this:
This is much like a double version of the birth chart dialog, with a few extra buttons.
The data set on the left ('startdata') is the same as the birth data set, and any changes made in the birth chart dialog will reflect in this window, as they will in the synastry chart dialog. These data can be read from disk usint the 'open..' command. The 'target data' (progression data on the right) can be set completely independently from the birth/start data, and so there are separate buttons called map for both to set the latitude/longitude information from a map. These data can be read from disk choosing open second and then read progressiodata from the file menu.
The data button will calculate the progression from the data sets entered. This is the standard situation. Clicking on the button once will change its name to now, meaning that the progression will be calculated from the start data set and the present moment (information taken from the computer's clock for date and time, and from the preferences dialog in the file menu for the location, timezone and daylight savings time).
Also normally this will be a transit progression, meaning that for both sets the planets are calculated where they actually are on that moment. Clicking on the transit button once will change it to second, meaning a secondary progression will be calculated. Then from the start date every day will represent one year. This is more appropriate for slow changing processes, a more general approach.
Clicking on the button again will change it to solar. Now a solar return chart will be calculated: starting from the target date the program will work backward in time until it finds a conjunction of the birth and the progressive sun (the birth sun being fixed). This is the solar return chart valid at the moment of the target date and it remains valid throughout the year following it. By the above shown dialog, the progressive sun would be some 9° in cancer (born on 1st of July), and that's where the progressive sun will be. Since a new solar return chart goes into effect on your birthday every year, it is good for estimating 'what kind of year it will be'.
Click on the same button once more to find a lunar return chart, which works the same as for the sun, but now the chart will be valid for 28 days, the time it takes for the moon to complete one cycle.
The copy button simply copies the startdata to the progressiondata boxes.
The 'target data' set can be read from disk using the read other item on the file menu and choosing 'read progression data'.
In the case of a synastry the dialog looks like this:
The main difference is that the data set on the right now represents the birth data for another person. Thus one can compare charts. It's much like a progression, but the calculations should be interpreted slightly differently.
Since only one house system can be active in a chart, with the above settings one can e.g. see how the planets for happy fall into the houses for lucky. To turn that situation around and see how lucky's planets fall into happy's houses, use the swap button.
Use the The list (seperate buttons for both parts) to take the birthdata from the list of charts, likewise there are separate map buttons to find the longitude/latitude information from a map.
Like in a birth chart, One can click in a house, or on a planet, sign or aspect to see more information.
There is no explanation available from the program for synastries or progressions, but please contact uranian software if you need help on an explanation. If you send an e-mail please include a picture of the chart.
In the info menu item in the charts menu only the first two items are available. The second item is now called 'these aspects', and show further information on the aspects.
A composite chart can be calculated from the contextual menu, right-click (or cntrl-click) and choose composite from the menu.
Animations
To enable animations go to the preferences item, which is located in the charts menu, and check the box marked animations. The planetarum and skyview are always animated.
All animations except the 'for now' chart (which runs in real time) are controlled by a panel. All animations start off in a 'frozen' state, and can be started by either pressing the spacebar, or pressing the 'play' button in the panel.
The time-step value may be changed form 1 minute (0:01) to 4 days (96:00). Clicking in the timestep-field will set the time-step to 23h56m, which is the length of a sidereal day. The earth rotates around its axis in 24 hours, but since it also rotates around the sun in a year, It only takes one sidereal day for the stars to appear in the same positions again as they were first. So when using skyview and stepsize is 23h56m the stars will appear immobile while the planets ('wandering stars') are on the move.
You can also use the spacebar to toggle pause on and off.
'0' on the keyboard or on the numeric keypad will hide/show the animation panel.
chart correction
This is much like an animated chart, but now you don't vary the progression data, but the birth data, to find an exact time of birth.
Normally the exact time of birth is not known. Even a difference of a few minutes can change the picture dramatically, so what to do? Well, you set up the calculation of a transit progression, based on something that happened of which you know exactly when it happened. Use something recent, so you are more certain of the exact moment. Set up the approximate birthdata on the left hand side and the known time and place in the right hand side items of the dialog. Than recalculate changing the time of birth by small amounts , using the control panel to find a time of birth such that the recent thing can be explained by a transit showing up in the progression. For instance, a change of job situation could show up as a planet moving into the tenth house or a saturn aspect. Depending on the situation Sagittarius or Mars may be involved. There’s always a lot going on in a progressive chart so choose your aim carefully. More precise corrections can be made by setting up a list of such things that one can trace quite easily in one’s life and that happened at a known moment. Now use that for finding the ‘best birthtime’ that will fit as much data as possible, if not all.
Planets
Here you will find information on the planets of the solar system as well as a number of calculations:
Planetarium
Watch the planets in their orbits around the sun. It is always an animation.The starting date is taken from the birth data as set in the calculation of a birth chart. Start the animation by pressing the spacebar or press play in the panel .The buttons at the bottom of the screen change the appearance of the planetarium.
If show zodiac is on (default) Also the zoodiacal houses are shown. The house of Aries (1st house), the line connecting the center to the first point of Ariës, will be slightly lighter then the others (that's where the sun will be as viewed from the earth on 21st of March).
Also you can set the earth at the center of the solar system and see the other planets make rather irrational paths. This is actually the model the Medieval scientist tried to understand using circles and epicircles.
The following keys will change your view :
7 or up-arrow: tilt up
1 or down-arrow: tilt down
8 : zoom in
5 : zoom out
4 or left-arrow: rotate left
6 or right-arrow: rotate right
0 show/hide buttons at the bottom of the screen as well as the animation panel.
Use the shift-key to make the changes go faster. Also: clicking on a planet opens up a window with the planet's coördinates,
geocentric (as seen from earth), or heliocentric (as seen from the sun) and some physical information.
Click on the 'hide planet' button at the bottom of the screen to make the window go away. It will be hidden automatically when you change the
screen from the planetarium to something else.
Option-click in the planetarium drawing will zoom in and command-click will zoom out.
The moon's distance to the earth is exaggerated, to show it more clearly.
Use the spacebar to toggle pause on/off and ESC to exit.
Ephemeris
In all ephemeris tables you will find the following abbreviations:
julian date = number of days that have passed since the start of the julian calender (jan 1st 4713 BC)
λ (labda) = longitude along the ecliptic, that is the distance from the spring equinox (0 degrees Aries)
β (beta) = latitude, that is the distance from the ecliptic.
α (alfa) = right ascension, measured in hours, which is the distance from the spring equinox measured along the equator.
δ (delta) = declination, that is the distance from the equator.
for both α and δ the subscript 2000 denotes that these are valid for the equinox 2000.0. (the equinox moves slowly over time)
mag=magnitude, or brightness of a celestial body. Negative or small numers mean very bright, larger numbers mean faint. The naked eye under favourable circumstances can see objects up to 6th magnitude.
rise and set= local times of rise and set (geocentric ephemeris only)
elongation = distance of a celestial body from the sun, measured along the ecliptic.
M = mean anomaly, distance of a celestial body from it's perihelion, measured along its orbit.
l = heliocentric longitude, same as λ above, but now as seen from the sun.
b = heliocentric latitude, same as β above, but now as seen from the sun.
ω (omega) =perihelion, the point where a celestial body is closest to the sun, measured from the spring equinox
node = point where the orbit of a celestial body crosses the ecliptic in upwards direction.
i=inclination, the angle of an orbit with the ecliptic
ε (epsilon) = ellipticity, a measure of how close an orbit resembles a circle, or is more stretched. ranges from 0 to 1, where 1 would be a perfect circle.
r = distance from the sun
rr = distance from the earth
Heliocentric
Calculation of the heliocentric ephemeris for seperate planets is located in the planets menu. A standard dialog comes up, which has
extra fields as compared to the birth chart dialog for setting an enddate for the ephemeris, and a timestep value. The unit is days.
Click OK to view the ephemeris. Listed are the date, the julian day number, distance from the sun, the mean anomaly M, the longitude l
and latitude b, the longitude of the perihelium (ω), the longitude of the ascending node, the inclination and the ellipticity.
Clicking in one of the headers of a column with longitudes toggles between decimal and degrees-minutes-seconds notation. Again clicking in
another place in the window pauses the calculation and ESC quits it, if the calculation date hasn't passed the set enddate before that.
Geocentric
Calculation of the geocentric ephemeris for a given planet, located in the planets menu. Listed are the date, the julian day number, the longitude labda (Greek l) and latitude beta, right ascension and declination referred to the J2000.0 equinox, times of rise and set, the sign the planet is in, and the distance from the earth (rr). Right ascension and declination may be used to place the planet in any other starmap. Note that times of rise and set are in local standarttime, so if daylight saving time is in effect for the date calculated, add one hour to find the appropriate times.
The ephemeris can show either apparent of astrometric positions, depending on the setting ot the last item in the geocentric menu, apparent positions. Astrometric position of planets (item not ticked) means the actual positions, where they actually are physically. Apparent position means: where they appear to be as seen from the earth (apparent positions ticked). The difference, only small, stems from the fact that light travels at a finite speed. The light from the sun e.g., takes approximately seven minutes to reach the earth, so apparently we see the sun where it was seven minutes before. In case of a planet both the earth and the planet will have moved, this is taken into account if one ticks "apparent positions". Since no information is supposed to travel faster than light this is the usual setting for viewing planets. Thus the effects of aberration and light-time are taken into account, but not the effect of refraction (due to the earth's atmosphere).
Geocentric ephemeris can also be shown in a starmap, where the path of a planet is shown as a solid line. Tick the use starmap item.
Ephemeris Table
This is the top item in the geocentric submenu. This is basically a numerical overview of all the major planets like one would find in a
printed ephemeris book.
Graphical
Again found in the planets menu. Shows the planets in their undulating movement going from sign to sign. Click on one of the planet buttons on the right to turn the visibility of this
planet on or off. 'Grid', situated below that, turns on or off a grid over the drawing for more clarity (or less!). 'Play' animates the movement
between the dates set in the dialog.
Elements
View a table of the orbital elements for the planets and a few minor planets choosing the elements item from the planets menu. Six elements totally determine the Kepler movement of any body circling the sun (or the earth). Note that for the asteroids the numbers given are actually the oscullating elements, while for the planets the mean elements are given. The elements are:
M - mean anonaly, that is the distance at a given instance of the body from its perihelium (perigeum) or point of closest approach to the sun (earth). Measured in degrees.
a - semi-major axis, that is half the length of the ellipse, measured in AU (astronomical unit). The distance Sun-Earth is one AU , which is 150 000 000 km.
i - inclination, the angle between the plane of the planet's orbit and the ecliptica ( the plane defined by the orbit of the earth).
ellipticity (epsilon). an ellipticity of 0.0 means a circle, an ellipticity near 1.0 means a very stretched ellipse.
node - the point at which the planet's orbit intersects the ecliptic. For the earth this number has no meaning.
perihelium- the point where the planet comes closest to the sun. Measured in degrees.
Except for the mean anomaly these numbers change slowly with time.
A tabular geocentric ephemeris for a comet is shown if in ephemeris is ticked in the submenu of the comet item.
For comets, files can be loaded from disk using open in the file menu or the data can be entered in a dialog which shows up when you
choose calculate... from the comets submenu. Numbers can be found in amateur astronomical magazines, or from Internet. Try for
instance Seiichi Yoshida's site, or the astrolomy website
for ready made comet files. The perihelion (point of closest approach to the sun) time should be entered as a Julian Date.
If the date is given as days-month-year use the Julian Date Calculator to convert this.
If the use starmap item is ticked in the comet submenu the track of the comet is shown in a starmap together with dates.
What starmap is used depends on the settings made in the stars menu. All functionality of
starmaps is available here.
If the in planetarium item is ticked you can see the comet in a planetarium.
In the last two cases the track of the comet can be draw as a solid line by ticking solid line.
This will show a list of eclipses for a period of about 20 years, starting from the date set in the dialogue. Date and time of the moment of
greatest eclipse are shown, together with what kind of eclipse it is.
Since the moon is not always at the same distance from the earth it will sometimes appear to be a little smaller or bigger. This is not
something you can see with the naked eye, it is a very subtle effect indeed. But it is important in solar eclipses. When the moon is closer to
the earth it will be big enough to easily cover the entire disk of the sun. This is a total eclipse, which can last several minutes. When the moon is a bit too far out,
it will be too small to cover the entire disk of the sun, and so a bright outline of the sun can still be seen around the moon. This is called an annular
eclipse, very spectacular too! Sometimes the eclipse is a 'near miss', the shadow of the moon passing by the earth, and only a part of the sun will be covered.
This will not have much effect at all, except that a 'bite' is taken out of the sun's disk. This is called a partial eclipse.
Total and annular eclipses can be shown in a map by clicking on an entry (not a partial one!) in the list. If not satisfied you can choose
another map in a contextual menu by right clicking or holding down the control-key while clicking in the map.
Starmaps
All single wheel charts may be shown in a starmap (if set in the preferences item on the charts menu), a comet may be shown in a starmap (set with preferences in the comet item in the planets menu), geocentric ehemeris (set by the last item on the geocentric menu) or a starmap can be shown by choosing starmap from the stars menu. This last choice will also reset the starmap to standard zoom and position and clear comets from the map.
A variety of starmaps may be shown. By default a map of the zodiac is shown as seen from the northern hemisphere. This may be changed using the button at the bottom left. Choose equator/hemisphere/zodiac/ecliptic, or southern sky. Drag to move the map across the screen, use command-(hold mouse down) to zoom out, option-(hold mouse down) to zoom into the map. This is also available if the starmap has been used to caculate a chart or to show a comet, whether animation is on or not. If a chart has already been calculated and you choose starmap, the planets will be shown in the map, and the date and time will be shown in the right bottom corner. Constellation shapes and names may be shown, and planets may be shown by their names or by their astrological glyphs.
A couple of special starmaps may be shown: one for each constellation, again showing the planets if a chart had been calculated. These maps may also show star names and constellation shapes and names if the options are ticked in the preferences menu. Clicking in this kind of map (which cannot be zoomed or dragged) shows the position of the mouse in the top right corner. The position is by right ascenscion/declination (equatorial coordinate system).
When a constellation is shown on the screen (as indicated by a constellation name at the bottom) the list item becomes available from the stars menu. This show a list of the stars in the constellation, together with some of their properties.
Another way to look at the stars is to just look up to the sky on a bright night. This is shown on your computer screen if you choose skyview, which is always animated, and automatically adjusts the view for where on earth you are. Again, this takes its information from the settings done in the preferences item on the file menu.
When first shown the view is always of the northern sky. Use the arrows in the bottom corners to view in a different direction. When looking south you will see the planets rise, travel through the sky, and set. This is a handy way to learn to recognize constellations and find the planets. Also here constellation names and shapes may be shown.
To view all the stars in the program in a list, choose catalogue. This shows the complete Yale Bright Star Catalogue (9110 stars). The list may be re-arranged by clicking in one of the column headers. This way you can sort the list by BSC-index, SAO (Smithsonian Astronomical Observatory)-index, right ascension (RA), declination (dec), magnitude, or distance.
All star positions are for J2000.0.
Use the keep button in the preferences menu item to save your personalised setting for the starmaps.
Others Items
bio-rhythm -A small item where one may calculate one's biorythm for today and the next two weeks. The data set when calculating a birth chart is used as birth data, and the present time is used for the calculation. So the first day on the left is .. today!
find tarotcard - calculate a Tarot card from a string using numerology.
calculate jdate - A Julian date calculator. Either enter date and time in the top half of the dialog and press the nearest 'go' button to find the corresponding julian day number, or enter a number in the textbox and press the go button just below it to find the date. Julian days start count from January 1st 4712 BC. Any postive Julian day number yields a meaningful result, but the earliest date that will calculate a correct Julian day is just after 1000 BC. Useful for comparing ephemerids, as well as an aid for the comet dialog box.
To just find the Julian Day that corresponds to a certain date just enter 0 for both DST and timezone. These are only important if you want to know what Greenwich Julian Day corresponds to a local time at your place, and vice versa, what date and time correspond to a given Julian Day for Greenwich. Suppose you read in a magazine that a comet will be in its perihelium (point of closest approach to the sun) on JD 2450444.1375 it means as the calculator will reveal this is on December 26 1996 at 15:18 local time in Greenwich. To know the local time at your place you will have to set the DST and timezone fields in the top half. The calculation from Julian Day to date will never change these fields, but only use them to find the right local time.
Help menu
Here you will find this manual, a list of the planets with their astrological meanings (click on a planet for more information), a link to the astrolomy site and an item to send an e-mail directly to uranian software.
Printing
When choosing print always the current screen is being printed (the outcome of the last calculation). Nearly all items are printable, but not the planetarium. In the case of an ephemeris if the print will lead to more than three pages of output a standard alert window is shown. Press OK to continue printing.
Please note that the printing layout has been finetuned for A4 papersize.
If the prints don't come out well (escpecially if the astrological symbols don't show up), please install the astrolomy font.
did you know you can..
- tell the next full moon quickly from the almanac in the planets menu
- tell how bright a planet is by looking in the geocentric ephemeris (tabular) and look in the column marked 'mag' (which stands for magnitude). negative numbers mean very bright, larger numbers around 4 or 5 mean faint.
changes in this version (4.1)
New in this version:
- system 10.8, now compatible with intel macs
- moonphase shown in starmaps (zoom in on the moon to see this)
- moon picture and phase shown in skyview
- charts shown in starmap now printable with starmap
- added messier's catalogue
- slightly changed organisation of the comets menu
- orbs can be set for the aspects
-
changes in version (4.0)
A number of changes in the algorithms have made the program faster and more accurate.
New in this version:
- first OS X version
- improved planetarium
- current and upcoming aspect lists show time when the aspect is or was full
- added new housesystems: Porphyry, Campanus, Regionmontanus, Topocentric
- charts in starmap (with aspects and houses)
- overview of astrological symbols for the planets
- almanac
- meteor showers shown in star map
- solar eclipses
- internationalised for english, french and dutch
-
known bugs
At times the animation controller disappears from the screen. The animation can still be controlled through the keyboard though, so pressing ESC will quit the animation.
contact
any questions, remarks or suggestions can be directed to uranian software